


−26%
70 Seiten
−26%
60 Seiten




Help students understand climate change through real data, critical thinking and evidence-based analysis.
This comprehensive climate data lab guides students through temperature trends, CO₂ emissions, greenhouse gases, sea level rise, glacier melt, extreme weather, food security, climate migration, tipping points and regional inequalities.
Instead of simply learning facts, students analyze charts, interpret tables, calculate changes, compare regions and evaluate climate scenarios.
✔ 45 pages of teaching material
✔ Climate data lab
✔ Temperature data
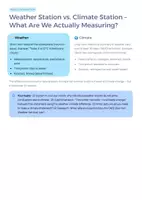
✔ Weather vs. climate
✔ Climate data sources
✔ Trend analysis
✔ CO₂ emissions
✔ Greenhouse effect
✔ Sea level rise
✔ Glacier melt
✔ Extreme weather
✔ Food security
✔ Climate migration
✔ Tipping points
✔ Regional climate impacts
✔ Final data analysis task
Students explore the difference between weather and climate, analyze temperature anomalies and learn how climate data is collected.
Students investigate global warming, regional temperature changes, heat records, climate proxies and long-term temperature reconstructions.
Students analyze the Keeling Curve, compare emission sectors, explore greenhouse gases and evaluate historical responsibility.
Students examine sea level rise, glacier melt, extreme weather, ocean acidification, agriculture, migration and tipping points.
Students compare climate impacts across Africa, island states, the Arctic, Asia and Europe.
Students evaluate mitigation, adaptation, policy choices and possible future scenarios.
Students apply their skills in a final evidence-based climate analysis.
analyze climate data
interpret graphs and tables
calculate trends and changes
explain greenhouse gases
compare regional impacts
evaluate climate risks
discuss climate justice
build evidence-based arguments
think critically about global challenges
Geography
Environmental Science
Earth Science
Social Studies
Civics
Climate Change Units
Data Analysis Lessons
STEM Projects
Secondary School
High School
Homeschool



Bewertungen und Kommentare